International Journal of Chemical Studies
  • Printed Journal
  • Indexed Journal
  • Refereed Journal
  • Peer Reviewed Journal
P-ISSN: 2349-8528, E-ISSN: 2321-4902   |   Impact Factor: GIF: 0.565

Vol. 7, Issue 1 (2019)

Soil organic carbon dynamics and their driving factors on cereal cropping systems productivity in confronting weather change challenges of sub tropical conditions: A review


.
Fig. 1: .


<strong>(a): </strong>Measured (symbols) and CQESTR predicted (lines) soil organic carbon in the 1 m soil depth for treatments (continuous wheat under no tillage, W–W/NT; wheat–wheat– sorghum ´ sudangrass hybrid under no tillage, W–W–S/NT; wheat–fallow under sweep tillage, W–F/ST; wheat–fallow under moldboard plow tillage, W–F/MP; and continuous chemical fallow, CF), <strong>(b): </strong>Measured (circles) and CQESTR-predicted (lines) soil organic carbon in the 1-m soil depth for continuous winter wheat under no tillage, <strong>(c):</strong> Soil organic carbon of measured (circles) and CQESTR-predicted (lines) in the 1-m soil depth for wheat–fallow under sweep tillage
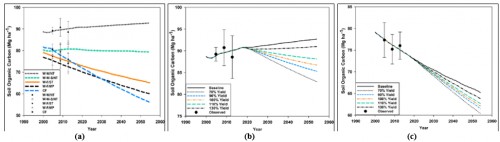
Fig. 2: (a): Measured (symbols) and CQESTR predicted (lines) soil organic carbon in the 1 m soil depth for treatments (continuous wheat under no tillage, W–W/NT; wheat–wheat– sorghum ´ sudangrass hybrid under no tillage, W–W–S/NT; wheat–fallow under sweep tillage, W–F/ST; wheat–fallow under moldboard plow tillage, W–F/MP; and continuous chemical fallow, CF), (b): Measured (circles) and CQESTR-predicted (lines) soil organic carbon in the 1-m soil depth for continuous winter wheat under no tillage, (c): Soil organic carbon of measured (circles) and CQESTR-predicted (lines) in the 1-m soil depth for wheat–fallow under sweep tillage


<strong>(a):</strong> Mean cereal productivity 1949–1998 correlated with mean cropland soil organic matter content, <strong>(b):</strong> Mean cereal yield variability (%) 1949–1998 against mean cropland soil organic matter content (%)
Fig. 3: (a): Mean cereal productivity 1949–1998 correlated with mean cropland soil organic matter content, (b): Mean cereal yield variability (%) 1949–1998 against mean cropland soil organic matter content (%)


<strong>(a): </strong>Soil Improving Cropping Systems (SICS), with crop rotations and the soil environment in the centre and the nine key agro management techniques, <strong>(b):</strong> Main driving forces and components of cropping Systems, <strong>(c):</strong><em></em>The effect of solid recycled organic material (manure) on the relative change and soil organic C (SOC) sequestration rates
Fig. 4: (a): Soil Improving Cropping Systems (SICS), with crop rotations and the soil environment in the centre and the nine key agro management techniques, (b): Main driving forces and components of cropping Systems, (c):The effect of solid recycled organic material (manure) on the relative change and soil organic C (SOC) sequestration rates


<strong>(a):</strong>The effect of aboveground crop residue handling on the relative change and soil organic C (SOC) sequestration rates, <strong>(b):</strong><em> </em>The effect of no-tillage on the relative change and soil organic C (SOC) sequestration rates
Fig. 5: (a):The effect of aboveground crop residue handling on the relative change and soil organic C (SOC) sequestration rates, (b): The effect of no-tillage on the relative change and soil organic C (SOC) sequestration rates


Combined, the direct and indirect effects of global change on ecosystems
Fig. 6: Combined, the direct and indirect effects of global change on ecosystems


The potential responses of plant and associated soil communities to climatic change. Plants and microbes may respond by shifting population ranges, symbiotic partners, or timing of phonological events. Each panel illustrates plant and soil community responses to climate change and highlight possible mismatches between interacting plants and microbes. Shapes of plants and microbes signify different species.
Fig. 7: The potential responses of plant and associated soil communities to climatic change. Plants and microbes may respond by shifting population ranges, symbiotic partners, or timing of phonological events. Each panel illustrates plant and soil community responses to climate change and highlight possible mismatches between interacting plants and microbes. Shapes of plants and microbes signify different species.


<strong>(a): </strong>Effects of climate change (increase in mean in variance and in mean and variance), <strong>(b): </strong>The agricultural production cycle as impacted by climate change
Fig. 8: (a): Effects of climate change (increase in mean in variance and in mean and variance), (b): The agricultural production cycle as impacted by climate change


<strong>(a):</strong> Temporal changes in the soil organic carbon (MgCha<sup>1</sup>) of the main global cereal cropping regions under different aboveground crop residue retention rates of 30% (a), 60% (b) and 90% (c), <strong>(b):</strong> Response of SOC change (1961–2014, MgCha<sup>-1</sup>) to the three most influential variables of crop residue retention rate (a), initial SOC (b), and mean annual precipitation (c)
Fig. 9: (a): Temporal changes in the soil organic carbon (MgCha1) of the main global cereal cropping regions under different aboveground crop residue retention rates of 30% (a), 60% (b) and 90% (c), (b): Response of SOC change (1961–2014, MgCha-1) to the three most influential variables of crop residue retention rate (a), initial SOC (b), and mean annual precipitation (c)


Call for book chapter
International Journal of Chemical Studies